- User Research
- UX Strategy
- Enterprise SaaS
- Design Systems
- Data Visualization

Context. One model behind every app
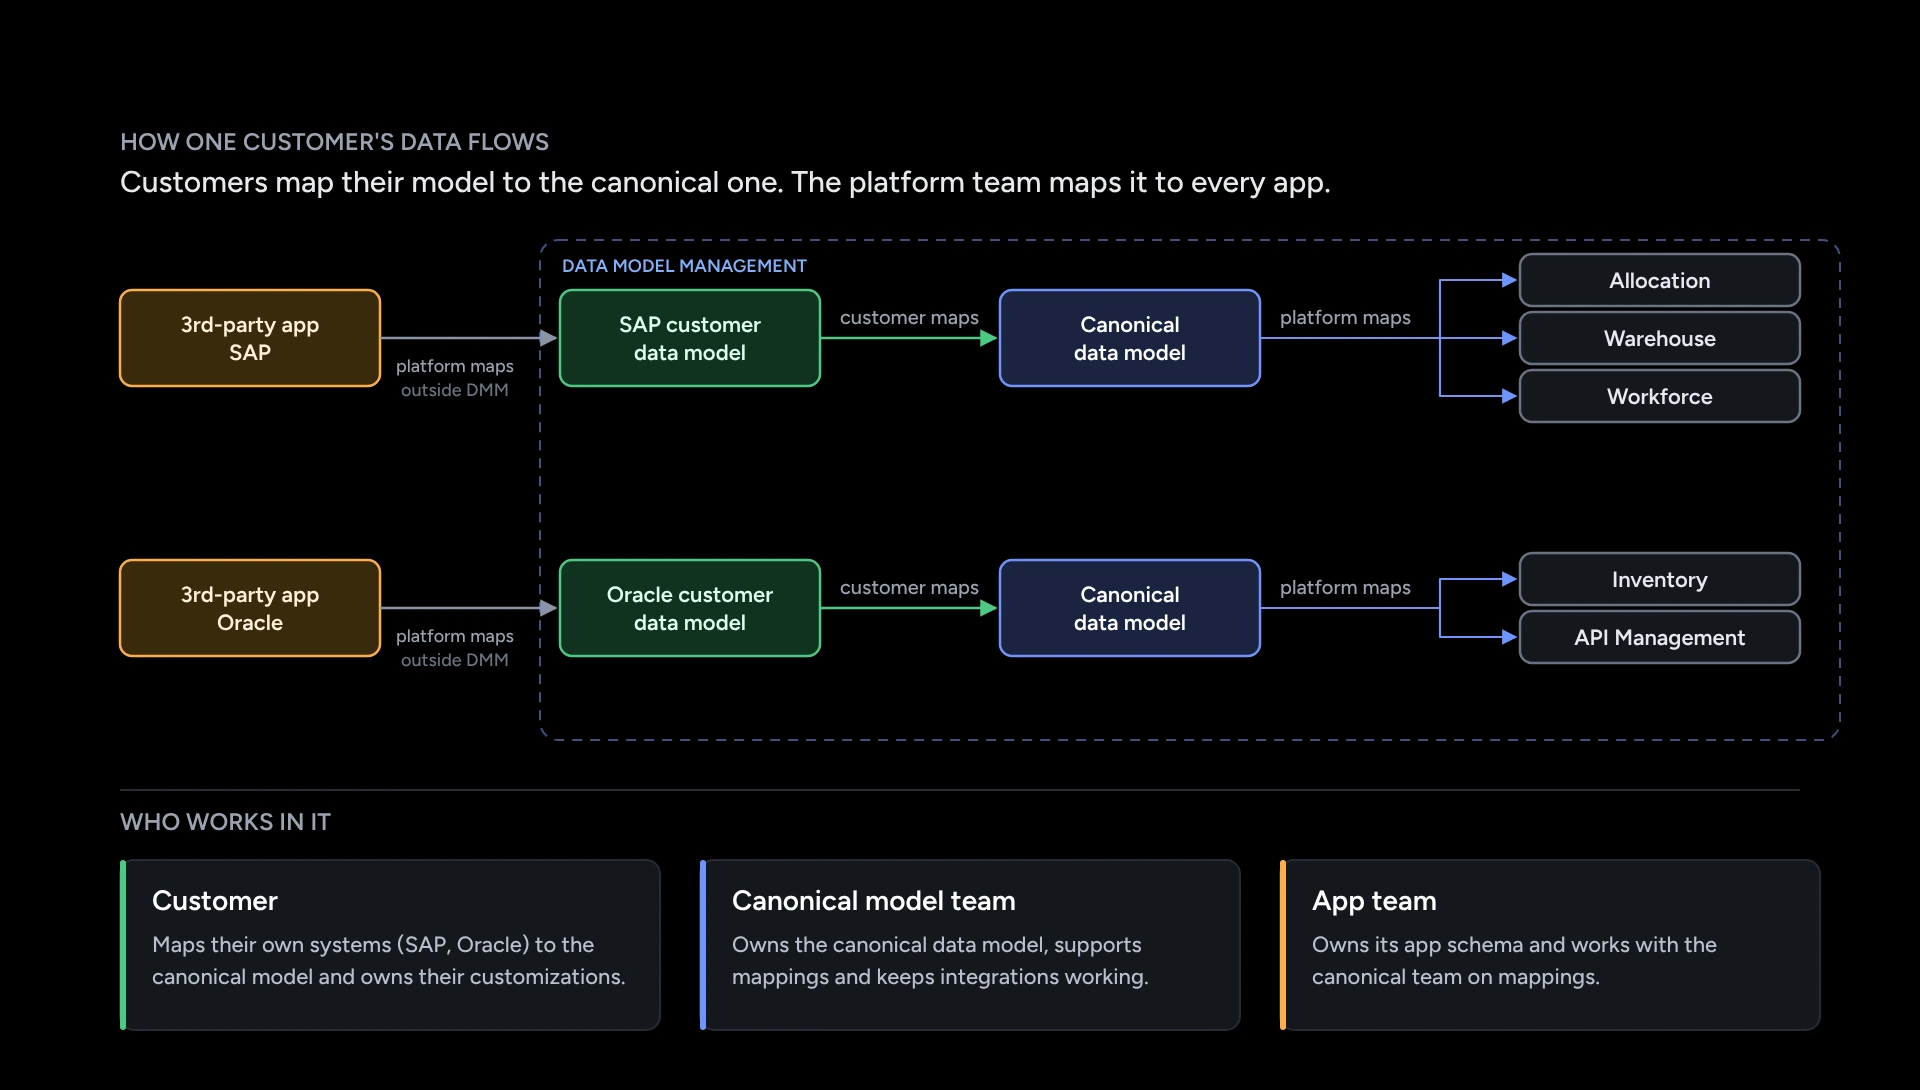
- Companies map their data from systems like SAP or Oracle to one shared model, the canonical model.
- The platform sends that model on to every app, from warehouse to workforce planning.
- One wrong mapping can break many apps at once. People need to spot it early.
Research. Why people got lost
- I interviewed 6 user roles. They fall into three groups: the team that owns the shared model, customers and admins. Each group has different rights, and each struggled in its own way.
- No two screens were alike. Layouts, names and buttons kept moving, and key actions were hidden.
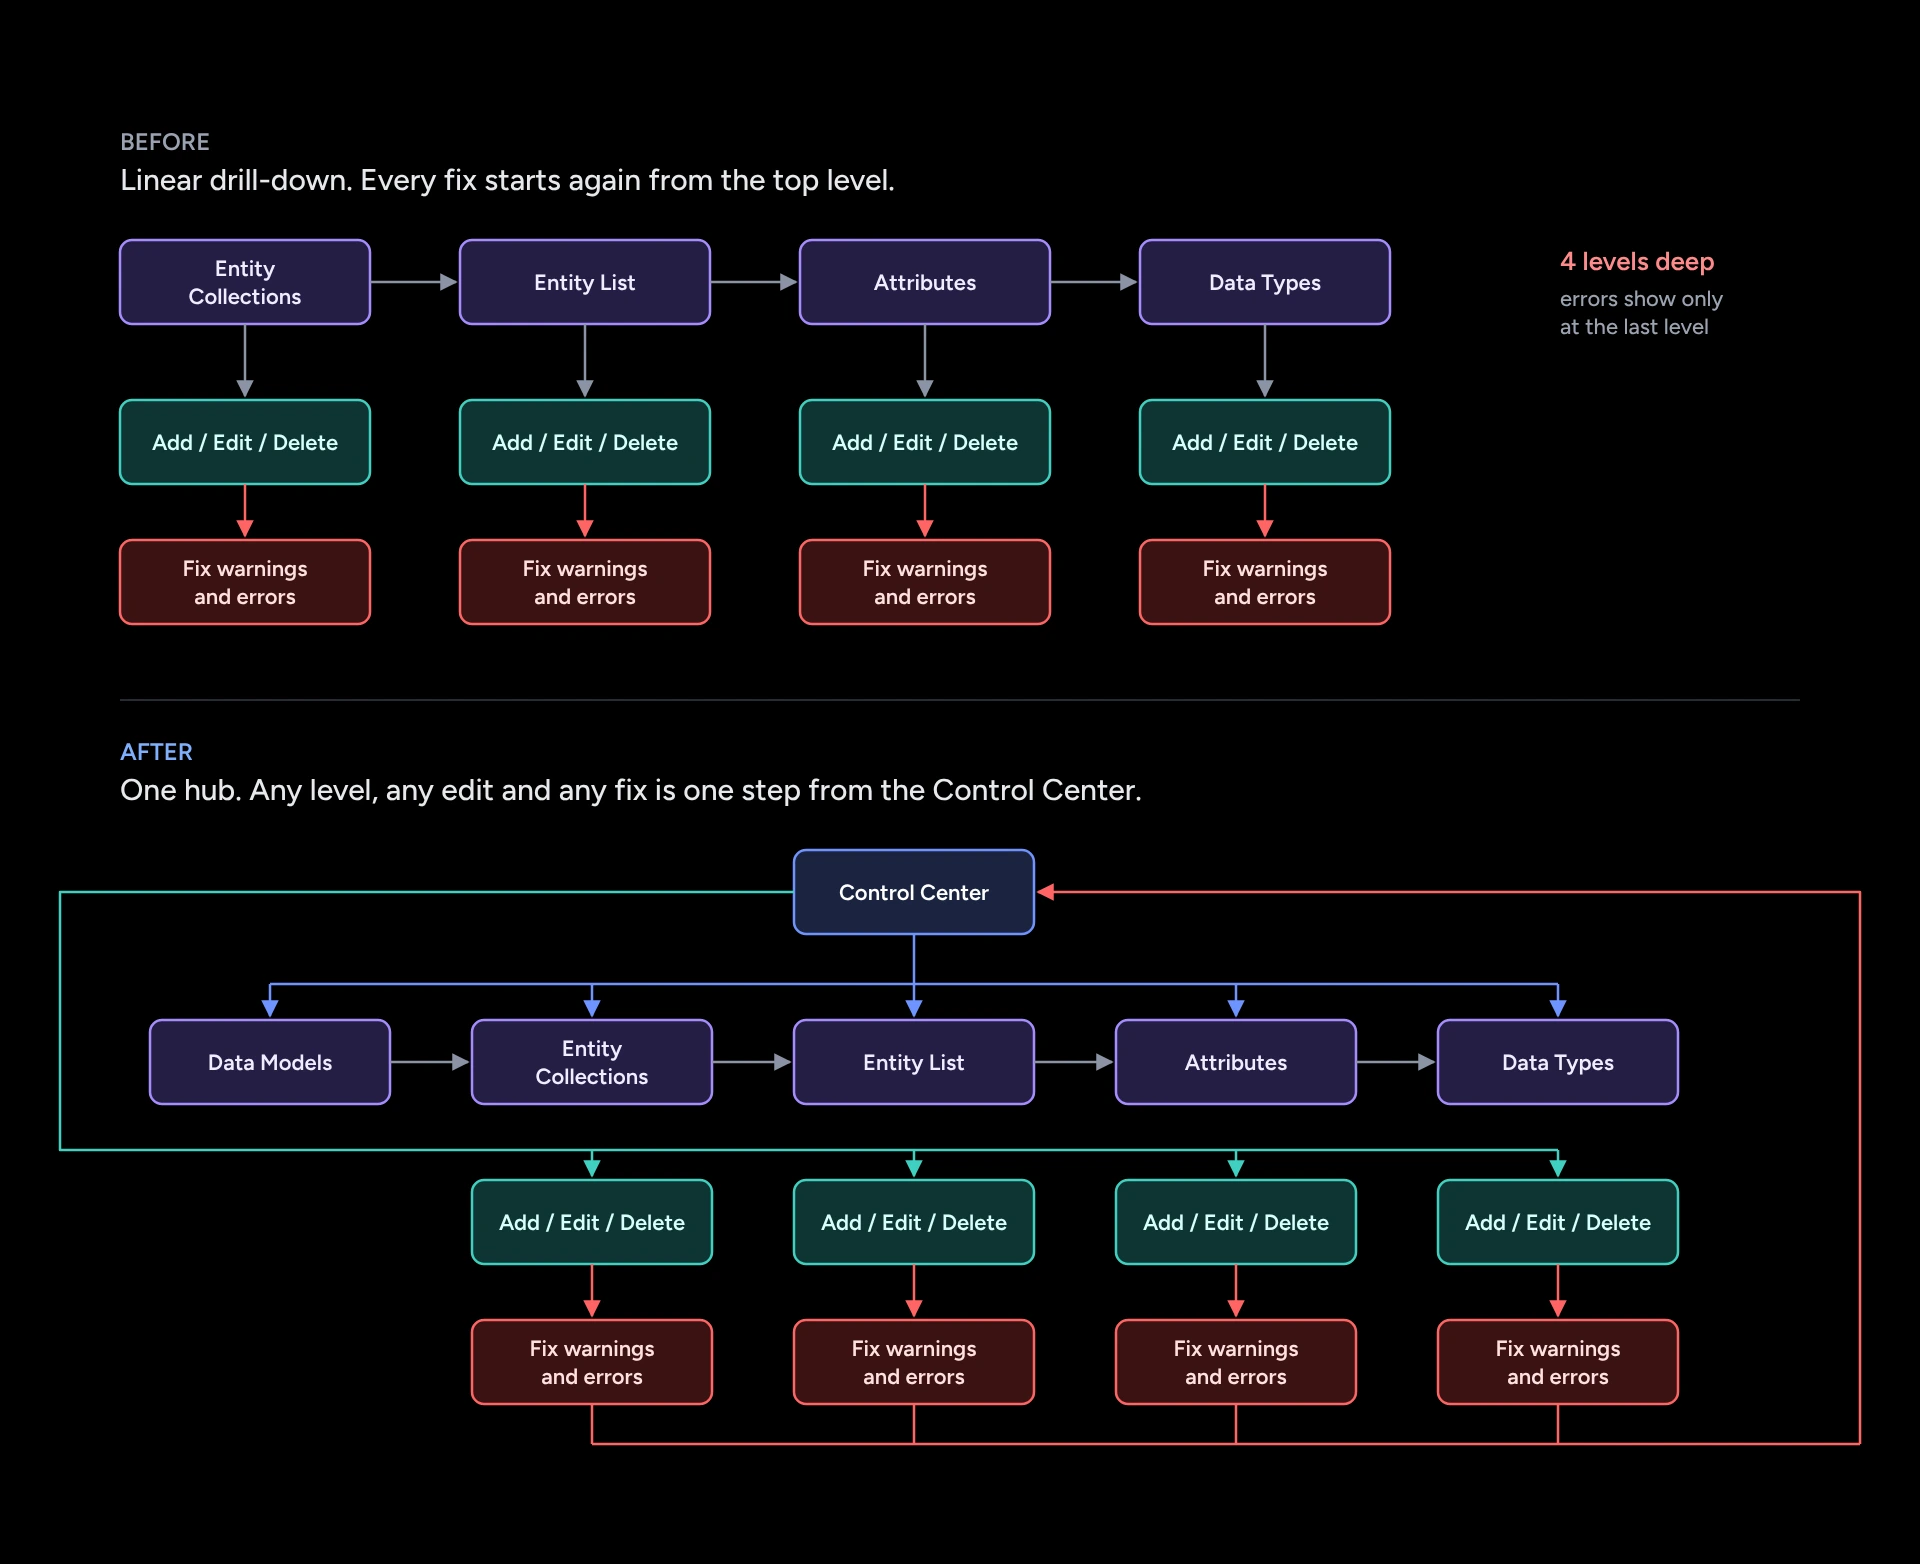
- To reach data, users clicked 4 levels deep, and errors waited at the bottom. Past level 3, users started to drop off.
What failed. Two versions that tested worse
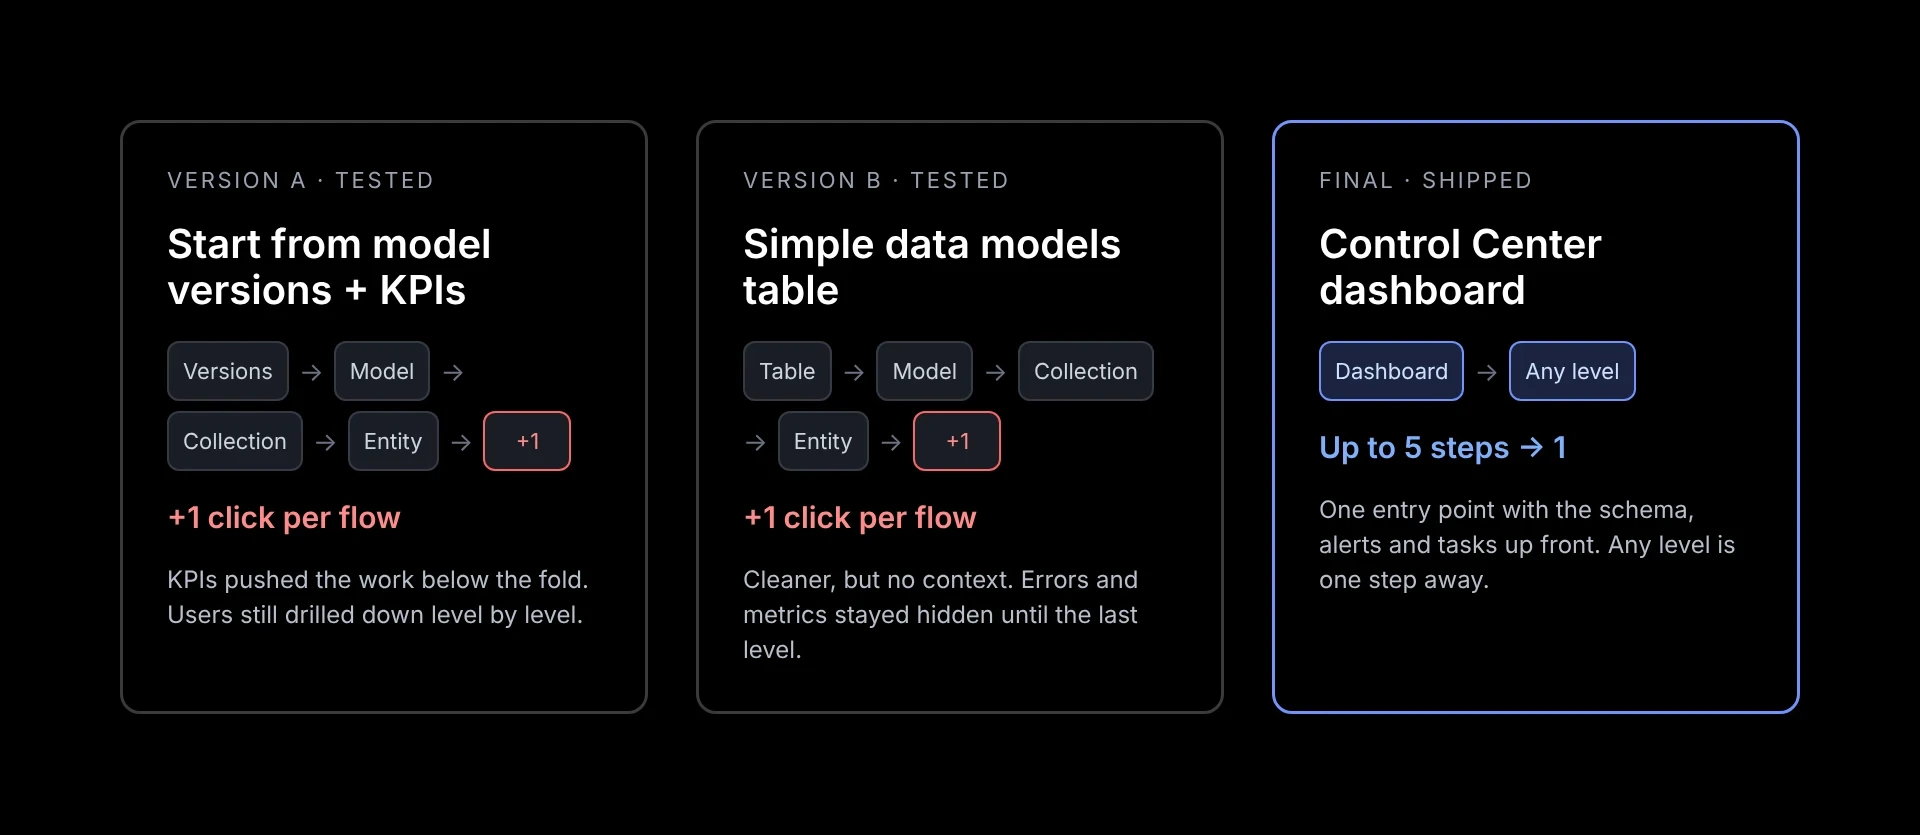
- Version A opened on model versions and KPI charts. The charts pushed the real work below the fold.
- Version B was a clean table. Nice to look at, but it gave no context and still hid errors until the last level.
- In user tests and UAT, both added a click to every task. A cleaner screen wasn't the fix. Users needed one place to start, so I pitched a central dashboard at a cross-team workshop, and the teams agreed to build it.
Final iteration. One dashboard, one entry point
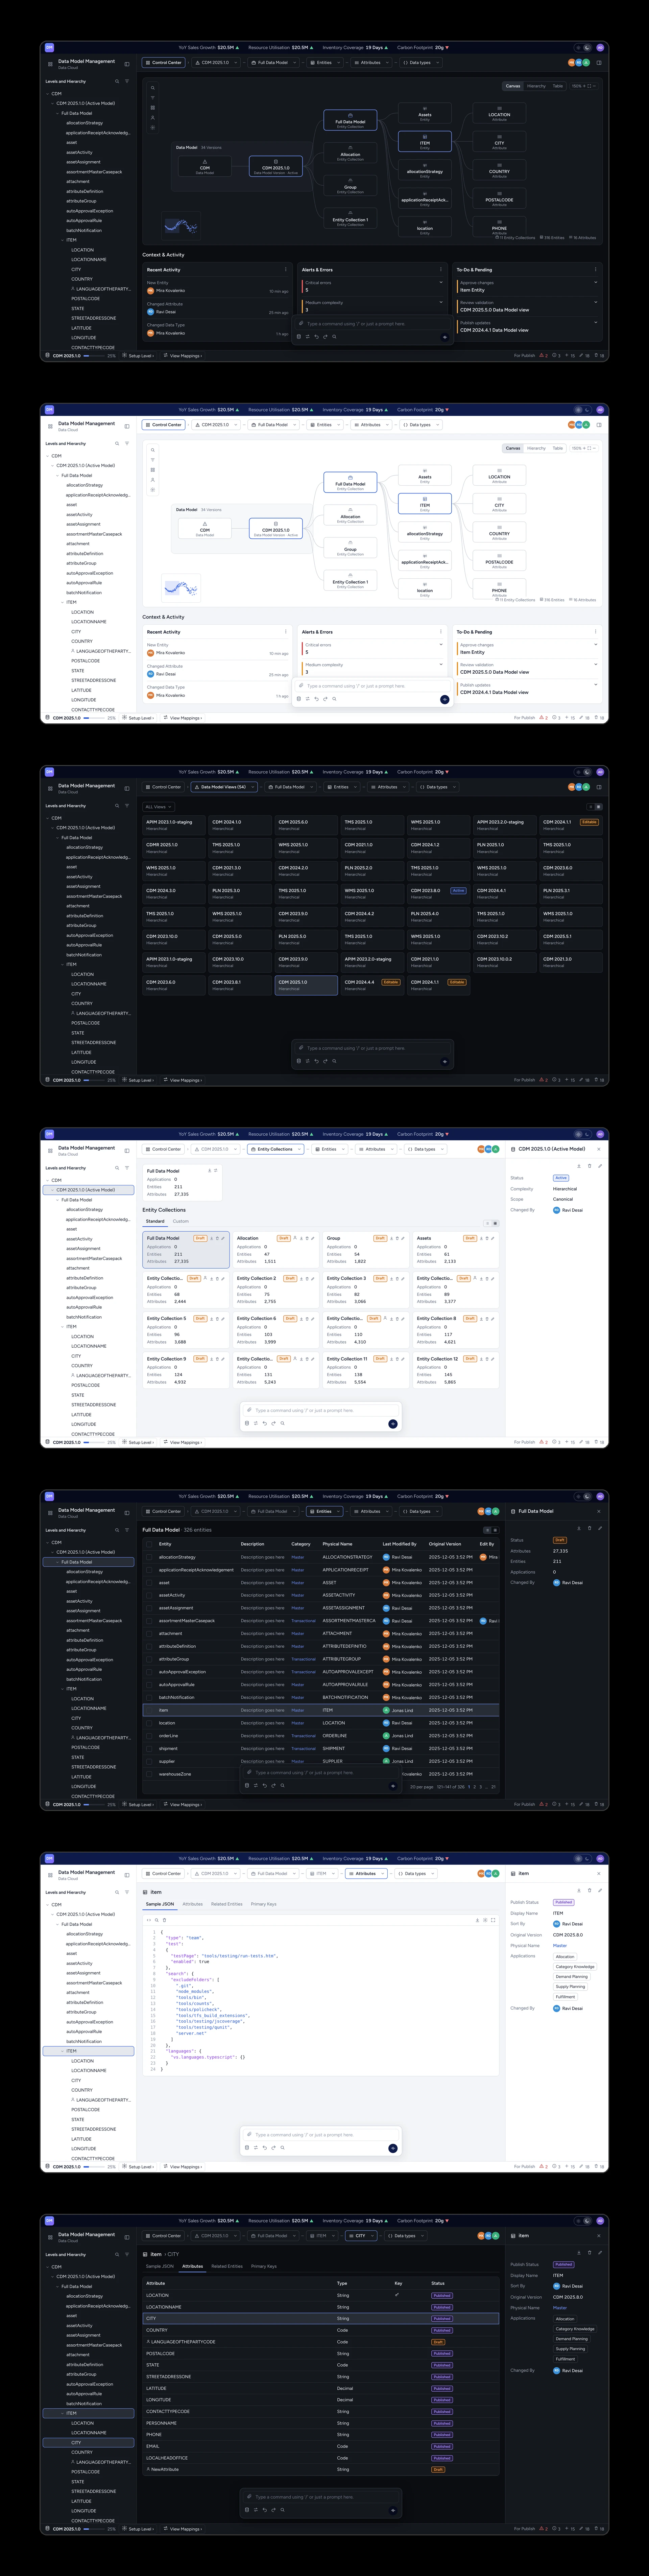
- Every task starts on the dashboard. Key numbers, errors and to-dos sit right at the top.
- The schema shows the whole model as a tree, a canvas or a table. Any level is one click away.
- I rebuilt every level on the same pattern: the same header, the same buttons in the same place, the same add and edit flow. Lists turned into compact tables, and detail pages need less scrolling.
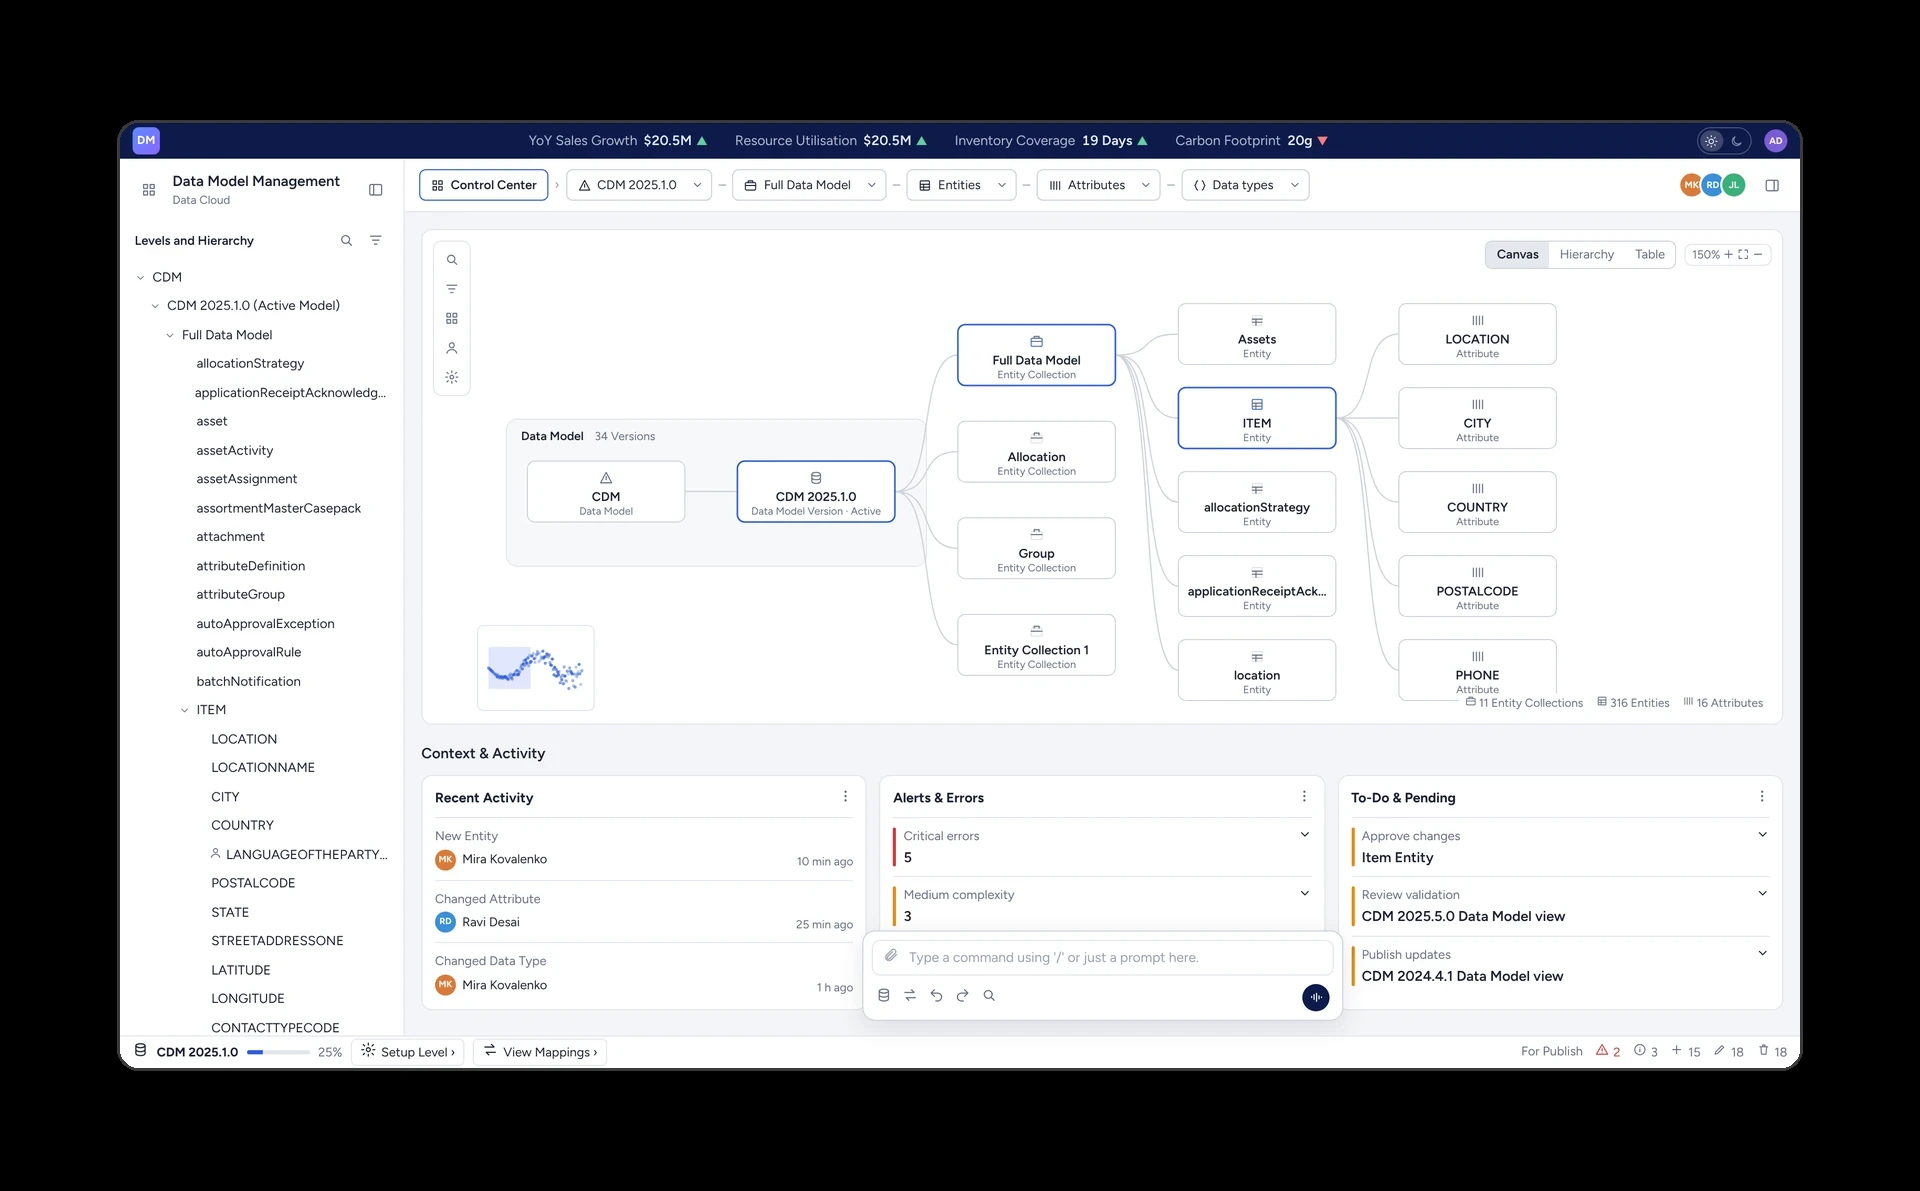
Prototype. Try the Control Center
- Try the final design yourself, in light or dark mode.
- Start on the dashboard and jump to any level from the breadcrumbs, the tree or the schema.
- Flip between cards and tables. All names and data are made up.

Open the interactive prototype: https://claude.ai/artifact/CoYg2dm2JR6q48MiFrXdzP
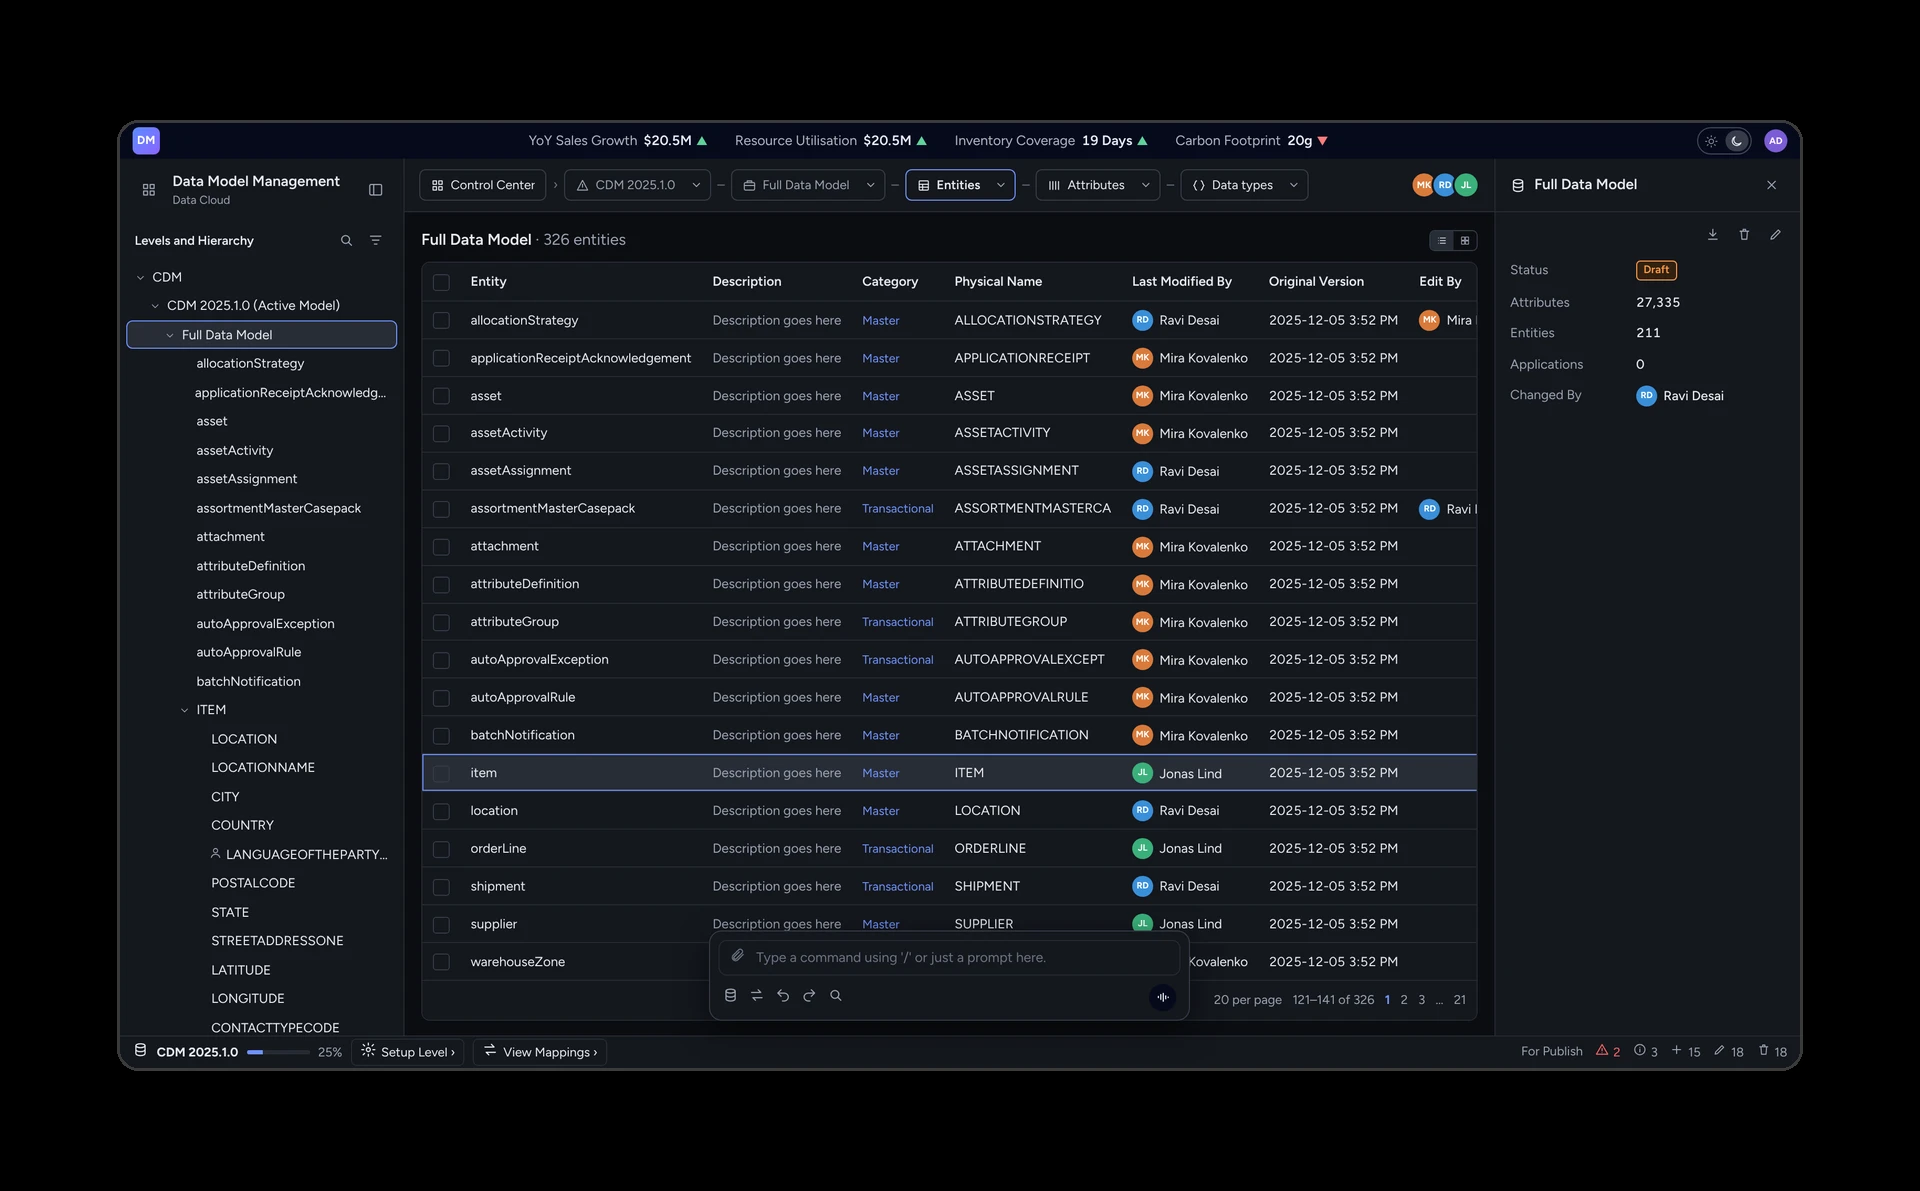
Up to 5 steps cut to 1. Any data level is one step from the dashboard, depending on depth.
At least 2x fewer clicks in the core workflows.
It shipped. Users switched with no pushback and called it the best system they had used.
Errors and to-dos show up front, so people fix problems before they spread to other apps.
My takeaway: a tidier screen can't fix a missing starting point. Testing two versions that failed is what got us to the dashboard.
Next step: bring the same pattern to other data-heavy products on the platform.